
Page 240 - MA-12
P. 240
2.2 Management Accounting (Section B)—ISC XII
• Comparative Balance Sheet
“Comparative Balance Sheet analysis is the study of the trend of same items, group of items and computed items
in two or more Balance Sheets of the same business enterprise on different dates.” —Foulka
• Comparative Income Statement, i.e., Statement of Profit and Loss
A Comparative Income Statement or Comparative Statement of Profit and Loss shows the operating results
for a number of accounting periods so that changes in data in terms of money and percentage from one
period to another may be known.
• Common-size Balance Sheet
Common-size Balance Sheet is the statement in which amounts of individual items of Balance Sheet
for two or more years are written. These amounts are further converted into percentage to a common
base which is total of Equity and Liabilities or total Assets.
• Common-size Income Statement, i.e., Statement of Profit and Loss.
Common-size Income Statement or Common-size Statement of Profit and Loss is the statement in which
amounts of individual items of Statement of Profit and Loss for two or more years are written. These
amounts are further converted into percentage to a common base which is Revenue from Operations.
Solved Questions
Illustration 1.
Prepare Comparative Income Statement (Statement of Profit and Loss) from the following
information:
Year Ended 31st March, 2019:
Revenue from Operations—` 9,60,000, Cost of Revenue from Operations—` 5,80,000, Office
and Administration Expenses—` 1,90,000, Selling and Distribution Expenses—` 70,000
and Other Expenses—` 5,000.
Year Ended 31st March, 2018:
Revenue from Operations—` 8,00,000, Cost of Revenue from Operations—` 5,00,000, Office
and Administration Expenses—` 1,40,000, Selling and Distribution Expenses—` 90,000
and Other Expenses—` 10,000.
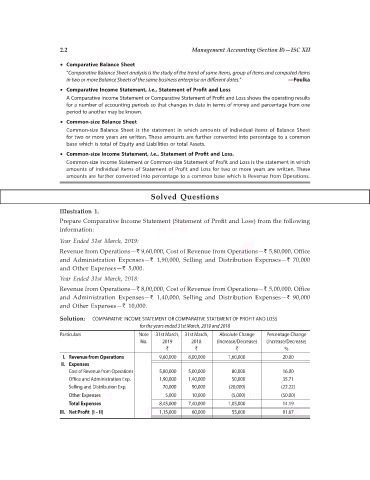
Solution: COMPARATIVE INCOME STATEMENT OR COMPARATIVE STATEMENT OF PROFIT AND LOSS
for the years ended 31st March, 2019 and 2018
Particulars Note 31st March, 31st March, Absolute Change Percentage Change
No. 2019 2018 (Increase/Decrease) (Increase/Decrease)
` ` ` %
I. Revenue from Operations 9,60,000 8,00,000 1,60,000 20.00
II. Expenses
Cost of Revenue from Operations 5,80,000 5,00,000 80,000 16.00
Office and Administration Exp. 1,90,000 1,40,000 50,000 35.71
Selling and Distribution Exp. 70,000 90,000 (20,000) (22.22)
Other Expenses 5,000 10,000 (5,000) (50.00)
Total Expenses 8,45,000 7,40,000 1,05,000 14.19
III. Net Profit (I – II) 1,15,000 60,000 55,000 91.67