
Page 349 - MA-12
P. 349
M.40 Management Accounting (Section B)—ISC XII
Working Notes:
1. Calculation of Credit Revenue from Operations:
Let Cash Revenue from Operation = X, credit Revenue from Operation will be 25% of X or X/4.
Total Revenue from Operations = Cash Revenue from Operations + Credit Revenue from Operation
` 1,50,000 = X + X/4
5X = ` 6,00,000
X = ` 6,00,000/5 = ` 1,20,000 (Cash Revenue from Operations)
Credit Revenue from Operations = ` 1,20,000 × 1/4 = ` 30,000.
2. Calculation of Average Trade Receivables:
Opening Trade Receivables = ` 40,000 – ` 20,000 = ` 20,000
Opening Trade Receivables + Closing Trade Receivables
Average Trade Receivables =
2
` 20,000 + ` 40,000
= = ` 30,000.
2
11.
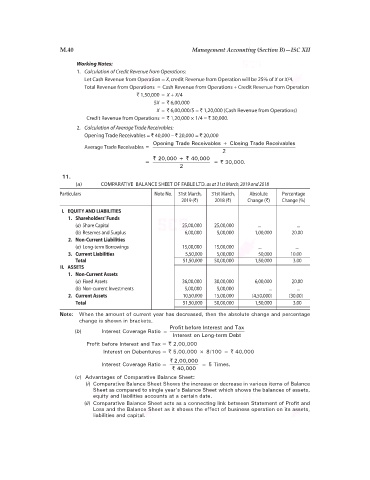
(a) COMPARATIVE BALANCE SHEET OF FABLE LTD. as at 31st March, 2019 and 2018
Particulars Note No. 31st March, 31st March, Absolute Percentage
2019 (`) 2018 (`) Change (`) Change (%)
I. EQUITY AND LIABILITIES
1. Shareholders’ Funds
(a) Share Capital 25,00,000 25,00,000 ... ...
(b) Reserves and Surplus 6,00,000 5,00,000 1,00,000 20.00
2. Non-Current Liabilities
(a) Long-term Borrowings 15,00,000 15,00,000 ... ...
3. Current Liabilities 5,50,000 5,00,000 50,000 10.00
Total 51,50,000 50,00,000 1,50,000 3.00
II. ASSETS
1. Non-Current Assets
(a) Fixed Assets 36,00,000 30,00,000 6,00,000 20.00
(b) Non-current Investments 5,00,000 5,00,000 ... ...
2. Current Assets 10,50,000 15,00,000 (4,50,000) (30.00)
Total 51,50,000 50,00,000 1,50,000 3.00
Note: When the amount of current year has decreased, then the absolute change and percentage
change is shown in brackets.
Profit before Interest and Tax
(b) Interest Coverage Ratio =
Interest on Long-term Debt
Profit before Interest and Tax = ` 2,00,000
Interest on Debentures = ` 5,00,000 × 8/100 = ` 40,000
` 2,00,000
Interest Coverage Ratio = = 5 Times.
` 40,000
(c) Advantages of Comparative Balance Sheet:
(i) Comparative Balance Sheet Shows the increase or decrease in various items of Balance
Sheet as compared to single year’s Balance Sheet which shows the balances of assets,
equity and liabilities accounts at a certain date.
(ii) Comparative Balance Sheet acts as a connecting link between Statement of Profit and
Loss and the Balance Sheet as it shows the effect of business operation on its assets,
liabilities and capital.