Page 131 - AAAXII
P. 131

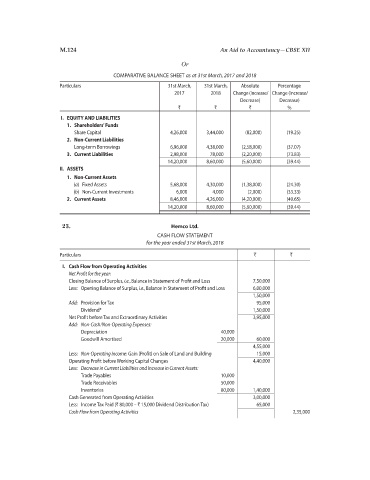
M.124                                                An Aid to Accountancy—CBSE XII
                                                             Or

                                       COMPARATIVE BALANCE SHEET as at 31st March, 2017 and 2018
                     Particulars                         31st March,   31st March,   Absolute   Percentage
                                                           2017        2018    Change (Increase/   Change (Increase/
                                                                                Decrease)    Decrease)
                                                            `           `          `            %
                      I.  EQUITY AND LIABILITIES
                        1.  Shareholders’ Funds
                          Share Capital                  4,26,000    3,44,000     (82,000)      (19.25)
                        2.  Non-Current Liabilities
                          Long-term Borrowings           6,96,000    4,38,000    (2,58,000)     (37.07)
                        3.  Current Liabilities          2,98,000      78,000    (2,20,000)     (73.83)
                                                         14,20,000   8,60,000    (5,60,000)     (39.44)
                       II.  ASSETS
                        1.  Non-Current Assets
                         (a)  Fixed Assets               5,68,000    4,30,000    (1,38,000)     (24.30)
                         (b)  Non-Current Investments      6,000       4,000       (2,000)      (33.33)
                        2.  Current Assets               8,46,000    4,26,000    (4,20,000)     (49.65)
                                                         14,20,000   8,60,000    (5,60,000)     (39.44)


                      23.                                 Hemco Ltd.
                                                     CASH FLOW STATEMENT
                                                 for the year ended 31st March, 2018
                     Particulars                                                     `           `
                       I.  Cash Flow from Operating Activities
                        Net Profit for the year:
                         Closing Balance of Surplus, i.e., Balance in Statement of Profit and Loss      7,50,000
                        Less:  Opening Balance of Surplus, i.e., Balance in Statement of Profit and Loss      6,00,000
                                                                                     1,50,000
                        Add:  Provision for Tax                                       95,000
                            Dividend*                                                1,50,000
                         Net Profit before Tax and Extraordinary Activities          3,95,000
                        Add:  Non-Cash/Non-Operating Expenses:
                            Depreciation                                  40,000
                            Goodwill Amortised                            20,000      60,000
                                                                                     4,55,000
                        Less:  Non-Operating Income: Gain (Profit) on Sale of Land and Building      15,000
                         Operating Profit before Working Capital Changes             4,40,000
                        Less:  Decrease in Current Liabilities and Increase in Current Assets:
                            Trade Payables                                10,000
                            Trade Receivables                             50,000
                            Inventories                                   80,000     1,40,000
                         Cash Generated from Operating Activities                    3,00,000
                        Less:  Income Tax Paid (` 80,000 – ` 15,000 Dividend Distribution Tax)      65,000
                        Cash Flow from Operating Activities                                       2,35,000
   126   127   128   129   130   131   132   133   134   135   136