Page 423 - AAAXII
P. 423

Model Test Papers                                                            M.405

                                                             Or
                          (a)  Shareholders’ Funds/Equity/Proprietors’ Funds.
                          (b)  Yes, if Non-operating Income exceed Non-operating Expenses.
                          (c)  Operating Profit Ratio = 100 – Operating Ratio
                                                   = 100 – 70 = 30%.
                          (d)  Improve. Reason:  Declaration of Dividend reduces the balance in Surplus, i.e.,
                             Balance in Statement of Profit and Loss and thus Shareholders’ Funds. In effect,
                             numerator (Debt) does not change but denominator (Shareholders’ Funds) reduces.
                             Therefore, Debt to Equity Ratio will improve.
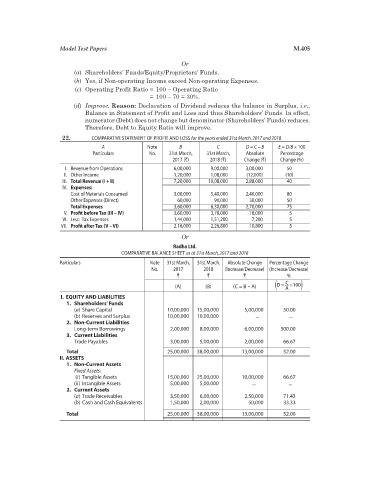
                      22.        COMPARATIVE STATEMENT OF PROFIT AND LOSS for the years ended 31st March, 2017 and 2018
                                   A              Note      B            C        D = C – B   E = D/B × 100
                                Particulars       No.    31st March,   31st March,   Absolute   Percentage
                                                          2017 (`)     2018 (`)   Change (`)   Change (%)
                       I.  Revenue from Operations         6,00,000    9,00,000   3,00,000      50
                       II.  Other Income                   1,20,000    1,08,000    (12,000)    (10)
                       III.  Total Revenue (I + II)        7,20,000   10,08,000   2,88,000      40
                       IV.  Expenses:
                        Cost of Materials Consumed         3,00,000    5,40,000   2,40,000      80
                          Other Expenses (Direct)           60,000      90,000      30,000      50
                        Total Expenses                     3,60,000    6,30,000   2,70,000      75
                       V.  Profit before Tax (III – IV)    3,60,000    3,78,000     18,000       5
                       VI.  Less:  Tax Expenses            1,44,000    1,51,200     7,200        5
                      VII.  Profit after Tax (V – VI)      2,16,000    2,26,800     10,800       5
                                                             Or
                                                          Radha Ltd.
                                         COMPARATIVE BALANCE SHEET as at 31st March, 2017 and 2018
                     Particulars                   Note   31st March,   31st March,   Absolute Change   Percentage Change
                                                   No.    2017      2018    (Increase/Decrease)  (Increase/Decrease)
                                                            `         `           `             %
                                                           (A)       (B)      (C = B – A)   ( D =  C  ¥100 )
                                                                                               A
                      I.  EQUITY AND LIABILITIES
                        1.  Shareholders’ Funds
                          (a) Share Capital             10,00,000   15,00,000     5,00,000     50.00
                          (b) Reserves and Surplus      10,00,000   10,00,000         ...        ...
                        2.  Non-Current Liabilities
                          Long-term Borrowings           2,00,000   8,00,000      6,00,000    300.00
                        3.  Current Liabilities
                          Trade Payables                 3,00,000   5,00,000      2,00,000     66.67
                       Total                            25,00,000  38,00,000     13,00,000     52.00
                       II. ASSETS
                        1.  Non-Current Assets
                          Fixed Assets:
                          (i) Tangible Assets           15,00,000   25,00,000    10,00,000     66.67
                          (ii) Intangible Assets         5,00,000   5,00,000         ...         ...
                        2.  Current Assets
                          (a) Trade Receivables          3,50,000   6,00,000      2,50,000     71.43
                          (b) Cash and Cash Equivalents   1,50,000   2,00,000      50,000      33.33

                       Total                            25,00,000  38,00,000     13,00,000     52.00
   418   419   420   421   422   423   424   425   426   427   428