
Page 104 - AAAXII
P. 104
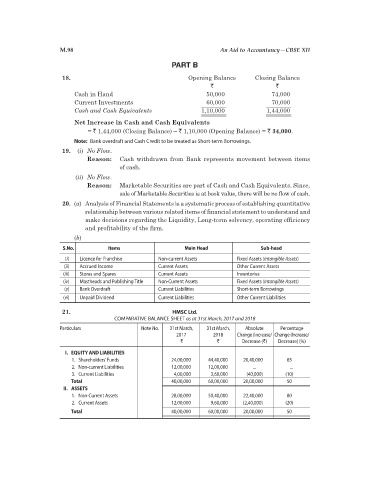
M.98                                                 An Aid to Accountancy—CBSE XII
                                                          PART B

                      18.                                      Opening Balance       Closing Balance
                                                                       `                    `
                          Cash in Hand                               50,000                74,000
                          Current Investments                        60,000                70,000
                          Cash and Cash Equivalents                 1,10,000             1,44,000
                          Net Increase in Cash and Cash Equivalents
                              = ` 1,44,000 (Closing Balance) – ` 1,10,000 (Opening Balance) = ` 34,000.
                          Note:  Bank overdraft and Cash Credit to be treated as Short-term Borrowings.
                      19.  (i)  No Flow.
                              Reason:    Cash withdrawn from Bank represents movement between items
                                         of cash.
                          (ii)  No Flow.
                              Reason:    Marketable Securities are part of Cash and Cash Equivalents. Since,
                                         sale of Marketable Securities is at book value, there will be no flow of cash.
                      20.  (a)  Analysis of Financial Statements is a systematic process of establishing quantitative
                             relationship between various related items of financial statement to understand and
                             make decisions regarding the Liquidity, Long-term solvency, operating efficiency
                             and profitability of the firm.
                          (b)

                      S.No.          Items                    Main Head                Sub-head
                       (i)   Licence for Franchise   Non-current Assets        Fixed Assets (Intangible Assets)
                       (ii)   Accrued Income         Current Assets            Other Current Assets
                       (iii)   Stores and Spares     Current Assets            Inventories
                       (iv)   Mastheads and Publishing Title   Non-Current Assets   Fixed Assets (Intangible Assets)
                       (v)   Bank Overdraft          Current Liabilities       Short-term Borrowings
                       (vi)   Unpaid Dividend        Current Liabilities       Other Current Liabilities

                      21.                                 HMSC Ltd.
                                       COMPARATIVE BALANCE SHEET as at 31st March, 2017 and 2018
                     Particulars                Note No.   31st March,    31st March,    Absolute   Percentage
                                                           2017         2018   Change (Increase/  Change (Increase/
                                                             `           `       Decrease (`)   Decrease) (%)
                       I.  EQUITY AND LIABILITIES
                         1.  Shareholders’ Funds          24,00,000   44,40,000   20,40,000     85
                         2.  Non-current Liabilities      12,00,000   12,00,000      ...         ...
                         3.  Current Liabilities           4,00,000    3,60,000    (40,000)    (10)
                         Total                            40,00,000   60,00,000   20,00,000     50
                       II.  ASSETS
                         1.  Non-Current Assets           28,00,000   50,40,000   22,40,000     80
                         2.  Current Assets               12,00,000    9,60,000   (2,40,000)   (20)
                          Total                           40,00,000   60,00,000   20,00,000     50