Page 210 - AAAXII
P. 210

M.200                                                An Aid to Accountancy—CBSE XII

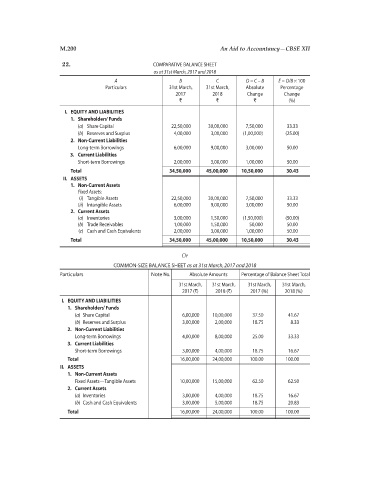
                      22.                           COMPARATIVE BALANCE SHEET
                                                    as at 31st March, 2017 and 2018
                                       A                    B            C        D = C – B   E = D/B × 100
                                    Particulars          31st March,   31st March,   Absolute   Percentage
                                                           2017        2018        Change      Change
                                                            `            `           `          (%)
                       I.  EQUITY AND LIABILITIES
                        1.  Shareholders’ Funds
                           (a)  Share Capital             22,50,000   30,00,000   7,50,000      33.33
                           (b)  Reserves and Surplus       4,00,000    3,00,000   (1,00,000)   (25.00)
                        2.  Non-Current Liabilities
                           Long-term Borrowings            6,00,000    9,00,000   3,00,000      50.00
                        3.  Current Liabilities
                           Short-term Borrowings           2,00,000    3,00,000   1,00,000      50.00
                        Total                            34,50,000   45,00,000   10,50,000      30.43
                       II.  ASSETS
                        1.  Non-Current Assets
                           Fixed Assets:
                           (i)  Tangible Assets           22,50,000   30,00,000   7,50,000      33.33
                           (ii)  Intangible Assets         6,00,000    9,00,000   3,00,000      50.00
                        2.  Current Assets
                            (a)  Inventories               3,00,000    1,50,000   (1,50,000)   (50.00)
                           (b)  Trade Receivables          1,00,000    1,50,000     50,000      50.00
                           (c)  Cash and Cash Equivalents   2,00,000   3,00,000   1,00,000      50.00
                        Total                            34,50,000   45,00,000   10,50,000      30.43

                                                             Or
                                       COMMON-SIZE BALANCE SHEET as at 31st March, 2017 and 2018
                     Particulars                   Note No.     Absolute Amounts   Percentage of Balance Sheet Total
                                                            31st March,   31st March,   31st March,   31st March,
                                                             2017 (`)   2018 (`)    2017 (%)   2018 (%)
                       I.  EQUITY AND LIABILITIES
                        1.  Shareholders’ Funds
                          (a)  Share Capital                 6,00,000   10,00,000    37.50      41.67
                          (b)  Reserves and Surplus          3,00,000   2,00,000     18.75       8.33
                        2.  Non-Current Liabilities
                          Long-term Borrowings               4,00,000   8,00,000     25.00      33.33
                        3.  Current Liabilities
                          Short-term Borrowings              3,00,000   4,00,000     18.75      16.67
                         Total                               16,00,000  24,00,000   100.00      100.00
                      II.  ASSETS
                        1.  Non-Current Assets
                          Fixed Assets—Tangible Assets       10,00,000   15,00,000   62.50      62.50
                        2.  Current Assets
                          (a)  Inventories                   3,00,000   4,00,000     18.75      16.67
                          (b)  Cash and Cash Equivalents     3,00,000   5,00,000     18.75      20.83
                         Total                               16,00,000  24,00,000   100.00      100.00
   205   206   207   208   209   210   211   212   213   214   215