Page 317 - AAAXII
P. 317

Model Test Papers                                                            M.303

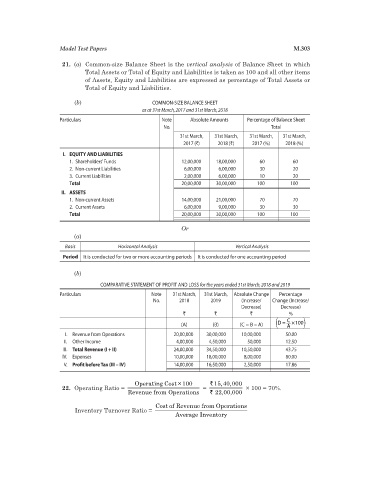
                      21.  (a)  Common-size Balance Sheet is the vertical analysis of Balance Sheet in which
                             Total Assets or Total of Equity and Liabilities is taken as 100 and all other items
                             of Assets, Equity and Liabilities are expressed as percentage of Total Assets or
                             Total of Equity and Liabilities.


                          (b)                      COMMON-SIZE BALANCE SHEET
                                                as at 31st March, 2017 and 31st March, 2018
                     Particulars                       Note     Absolute Amounts   Percentage of Balance Sheet
                                                       No.                                 Total
                                                             31st March,   31st March,   31st March,   31st March,
                                                              2017 (`)   2018 (`)   2017 (%)   2018 (%)
                       I.  EQUITY AND LIABILITIES
                         1.  Shareholders’ Funds             12,00,000   18,00,000     60         60
                         2.  Non-current Liabilities          6,00,000   6,00,000      30         20
                         3.  Current Liabilities              2,00,000   6,00,000      10         20
                        Total                                20,00,000   30,00,000    100        100
                      II.  ASSETS
                         1.  Non-current Assets              14,00,000   21,00,000     70         70
                         2.  Current Assets                   6,00,000   9,00,000      30         30
                        Total                                20,00,000   30,00,000    100        100
                                                             Or
                          (a)
                       Basis            Horizontal Analysis                    Vertical Analysis
                          Period   It is conducted for two or more accounting periods  It is conducted for one accounting period


                          (b)
                                  COMPARATIVE STATEMENT OF PROFIT AND LOSS for the years ended 31st March, 2018 and 2019
                     Particulars                   Note   31st March,   31st March,   Absolute Change   Percentage
                                                    No.     2018       2019      (Increase/   Change (Increase/
                                                                                 Decrease)    Decrease)
                                                              `         `           `            %
                                                             (A)       (B)      (C = B – A)  ( D =  C  ¥ 100 )
                                                                                                A
                       I.  Revenue from Operations         20,00,000   30,00,000   10,00,000    50.00
                       II.  Other Income                   4,00,000   4,50,000     50,000       12.50
                       III.  Total Revenue (I + II)        24,00,000  34,50,000  10,50,000      43.75
                       IV.  Expenses                       10,00,000  18,00,000   8,00,000      80.00
                       V.  Profit before Tax (III – IV)    14,00,000  16,50,000   2,50,000      17.86

                                              Operating Cost × 100     `  15,40,000
                      22.  Operating Ratio =                         =             × 100 = 70%.
                                           Revenue from Operations    `  22,00,000

                                                    Cost of Revenue from Operations
                           Inventory Turnover Ratio =
                                                           Average Inventory
   312   313   314   315   316   317   318   319   320   321   322