Page 259 - MA-12
P. 259

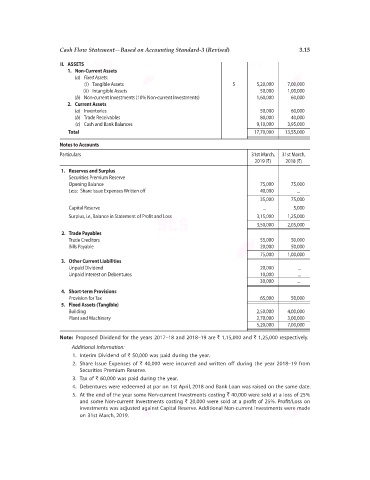
Cash Flow Statement—Based on Accounting Standard-3 (Revised)                   3.15

                      II.  ASSETS
                        1.  Non-Current Assets
                          (a)  Fixed Assets:
                             (i)  Tangible Assets                             5       5,20,000   7,00,000
                             (ii)  Intangible Assets                                   50,000   1,00,000
                          (b)  Non-current Investments (10% Non-current Investments)      1,60,000   60,000
                        2.  Current Assets
                          (a)  Inventories                                             50,000    60,000
                          (b)  Trade Receivables                                       80,000    40,000
                          (c)  Cash and Bank Balances                                 9,10,000   3,95,000
                         Total                                                       17,70,000   13,55,000
                     Notes to Accounts
                     Particulars                                                    31st March,   31st March,
                                                                                     2019 (`)   2018 (`)
                      1.  Reserves and Surplus
                         Securities Premium Reserve
                         Opening Balance                                               75,000    75,000
                        Less:  Share Issue Expenses Written off                        40,000      ...
                                                                                       35,000    75,000
                         Capital Reserve                                                ...       5,000
                         Surplus, i.e., Balance in Statement of Profit and Loss       3,15,000   1,25,000
                                                                                      3,50,000   2,05,000
                      2.  Trade Payables
                         Trade Creditors                                               55,000    50,000
                         Bills Payable                                                 20,000    50,000
                                                                                       75,000   1,00,000
                      3.  Other Current Liabilities
                        Unpaid Dividend                                                20,000       ...
                         Unpaid Interest on Debentures                                 10,000       ...
                                                                                       30,000      ...

                      4.  Short-term Provisions
                        Provision for Tax                                              65,000    50,000
                      5.  Fixed Assets (Tangible)
                        Building                                                      2,50,000  4,00,000
                         Plant and Machinery                                          2,70,000   3,00,000
                                                                                      5,20,000   7,00,000

                     Note:  Proposed Dividend for the years 2017–18 and 2018–19 are ` 1,15,000 and ` 1,25,000 respectively.
                         Additional Information:
                         1.  Interim Dividend of ` 50,000 was paid during the year.
                         2.  Share Issue Expenses of  ` 40,000 were incurred and written off during the year 2018–19 from
                           Securities Premium Reserve.
                         3.  Tax of ` 60,000 was paid during the year.
                         4.  Debentures were redeemed at par on 1st April, 2018 and Bank Loan was raised on the same date.
                         5.  At the end of the year some Non-current Investments costing ` 40,000 were sold at a loss of 25%
                           and some Non-current Investments costing ` 20,000 were sold at a profit of 25%. Profit/Loss on
                           investments was adjusted against Capital Reserve. Additional Non-current investments were made
                           on 31st March, 2019.
   254   255   256   257   258   259   260   261   262   263   264